Creating Graphs
Advertisement
Statcato v.0.9.12
Statcato is a free Java program application developed for elementary statistical computations. Its features are tailored for community college statistics students and instructors.Statcato has two main windows: Log,
Advertisement

Make Professional looking graphs with Java 3d Graph Software v.9.0
With 1-2-3 PieCharts you can now quickly and easily create professional looking 3d graphs without any of the usual hassle.
Graphs Made Easy v.3 1
Graphs Made Easy (GME) is an easy way to make great looking graphs in minutes. The traditional approach of spreadsheets and data grids is replaced with simplified data entry. Graphs Made Easy Basic is freeware.
PHP DataForm - PHP script for creating HTML Forms v.1.0.1
PHP Dataform (PHP DF) script is a simple tool for creating HTML Forms with ease. It was especially designed for web developers, who do not want to spend excessive time on creating Forms in HTML or through PHP,
Infowise Graphs v.1.0.7
Analyze your list data as simple and visually appealing graphs and charts. Infowise Graphs enables users to create a graphic interface to SharePoint lists, and in the current version contains two web parts with the following abilities: 1. Pie Chart:

Gxlbrowse - interactive graphviz graphs v.1.0
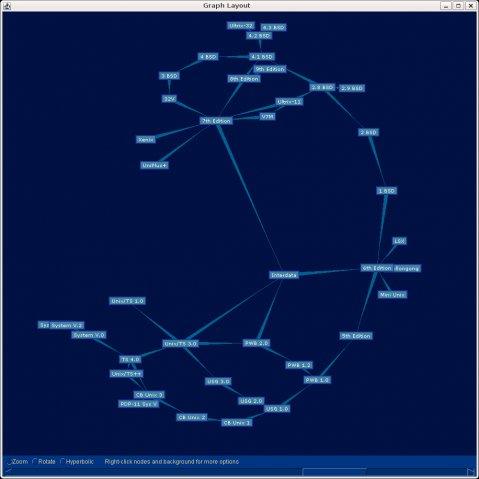
gxlbrowse is a simple utility that reads graphs in the GraphViz XML format (GXL) and presents them in an interactive browser.
Web Design Software for creating websites v.9.0
Create websites with this great web design software.
GLE v.4. 2. 2003
GLE (Graphics Layout Engine) is a graphics scripting language designed for creating publication quality graphs, plots, diagrams, figures and slides.
TINTFU v.6.0
This is an editor for GraphViz, an excellent program imho for both quickly creating a graphical overview of some collection of related components as well as drawing graphs for systems which are too complex to manage using conventional drawing program
Ngraph for Windows v.6.03.52
Ngraph is the software creating scientific 2-dimensinal graphs for the researcher and engineer. Ngraph reads numerical data from a flexible text file, and plots it in the graph. Ngraph can create the graph sutable for presentations and for papers.
TikZiT v.0.7 Beta
Design node-and-edge style graphs with this tool. TikZiT is a graphical tool for rapidly creating an editing node-and-edge style graphs. It was originally created to aid in the typesetting of "dot" diagrams of interacting quantum observables,